


 Team
Team FAQ
FAQ Prices
 Vacancies
 Contact
 Marketing
 SEO
SEO SEA
SEA Strategy
 Sales
Sales Optimization
 AWR
AWR Ahrefs
 Channable
 ContentKing
 Leadinfo
 Optmyzr
 Qooqie
 Hubspot
 Semrush
- Achieve ambitious growth targets
- Increase market share
- Sustainable competitive advantage
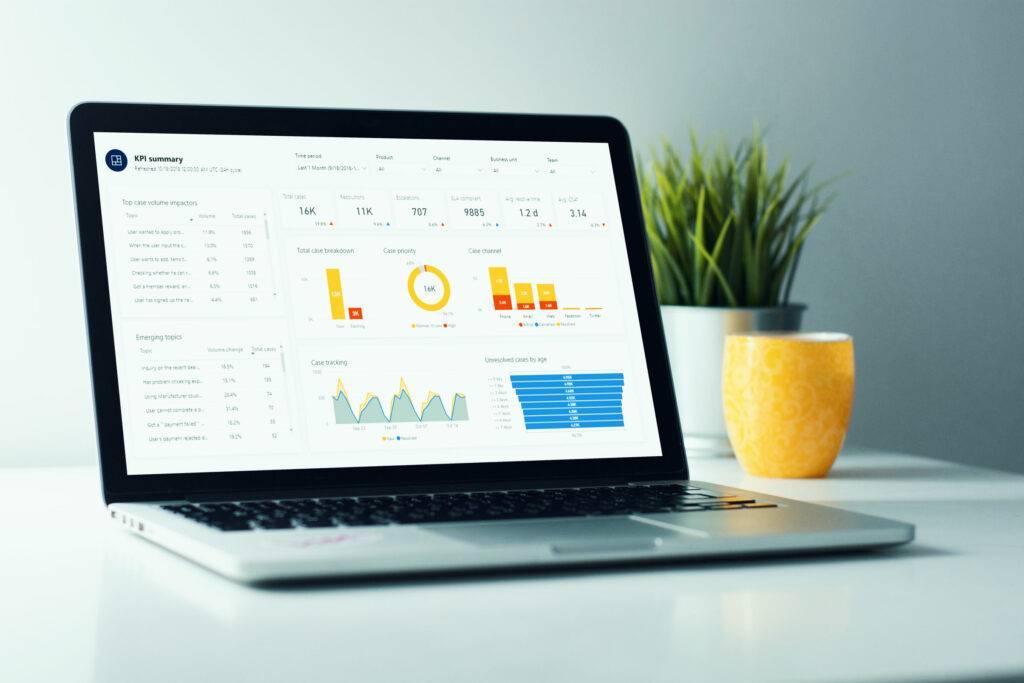
Analytics and statistics provide numbers that have a whole story behind them. Through our dashboard we interpret these figures based on validity and reliability. So you are never surprised by wrong conclusions or interpretations.
The dashboard also shows at a glance the status of the kpi's and how successful the organization is. It gives control over performance and is the measurement and control room from which you manage the organization.

Interpretation of figures
In itself, statistics don't say much. The story behind the numbers only becomes clear in the dashboard.
Valid and reliable
The data in the dashboard are always valid and reliable. So you avoid misinterpretations.
Everything at a glance
Thanks to the interface, you have all the data at your fingertips and can immediately see how the organization is doing.
Cockpit of the organization
From the dasboard, as management, you can immediately see what adjustments are needed where.


Is your company missing opportunities?
Our pay is based on your results.